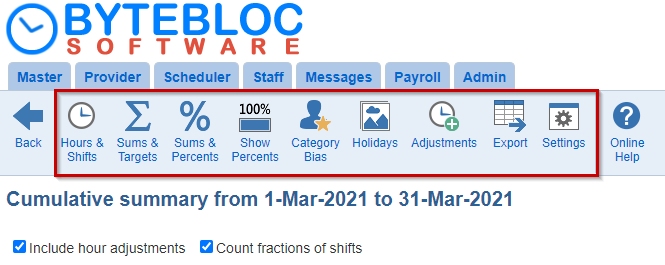
Generate summary statistics of shifts and hours providers for current version of the schedule. The name of the current time period being summarized is shown at the top of the screen.
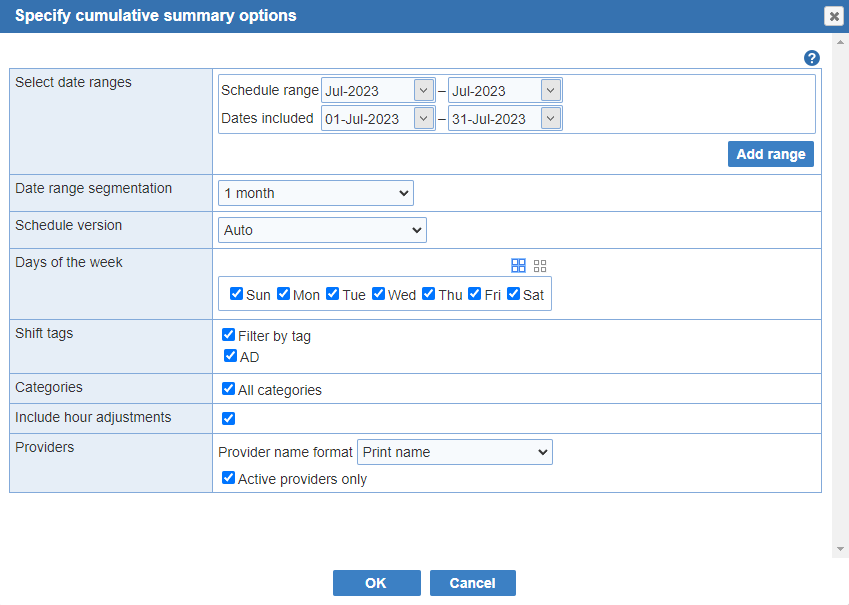
Select date ranges: Select your schedule range period first and then click on dates included to pick the specific date from the calendar pop up.
Date range segmentation: (Optional) Allow segmentation of the cumulative summary by period. Choose between 'No segmentation', '2 weeks', '1 month', '3 months', '6 months' and '1 year' from the menu selection.
Example: Date range from January 2025 through June 2025 with segmentation of 1 month. The summary will have 6 columns for each category, corresponding to the months of January through June.
Limitations:
- Not supported when multiple date ranges are selected.
- When a summary is segmented, targets and adjustments are not available.
- Auto: the first available of the following scheduled revisions for the schedule(s) relevant to the report period will be used to compute the payroll: 'Adjusted as-worked', 'As-worked', 'As-scheduled', or the most recently created 'working revision'
- Adjusted As-worked schedule: the payroll will be computed using the 'Adjusted as-worked' revisions for the schedules relevant to the report period
- As-worked schedule: the payroll will be computed using the 'As-worked' revisions for the schedules relevant to the report period
- As-scheduled schedule: the payroll will be computed using the 'As-scheduled' revisions for the schedules relevant to the report period
- Draft schedule: Post the schedule to review a proposed 'Draft' schedule before the schedule is finalized.
- Request schedule: Publish the schedule for providers to enter in their time off due to vacation and other obligations.
- Most recently created: the payroll will be computed using the most recently created working revisions for the schedules relevant to the report period
Days of the week: (Required field)A filter to report the days of the week. At least one day must be selected.
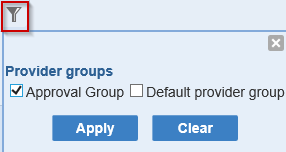
Shift tags: (Optional) Generate for shifts with specific tags
Categories: (Required field) The display/print categories from 'Categories' are set as default when the 'All categories' are selected. At least one category must be selected.
Include hour adjustments: (Optional) Includes a listing of all adjustment entries made during the period covered by the 'cumulative summary'.
Providers: (Optional)Provider name format (Print name, Last name, first name & Last name, first initial), Include provider IDs (Provider ID 1 & Provider ID 2) and Active providers only
- The format for provider names in reports can be specified. A default format is defined at the level of locations.
- Excludes inactive providers from the 'cumulative summary'.
After you have created and saved one or more schedules, either by manually entering old schedules or by automated scheduling, you can request ByteBloc to calculate a 'cumulative summary' of those schedules. Recall that when you originally customized ByteBloc for your schedule, you defined specific 'categories of summary' information of interest to you. ByteBloc has totaled the summary values in each defined category for each provider for all of the schedules in the range of schedules you selected to summarize and is now displaying this cumulative information on the 'Cumulative summary' screen.
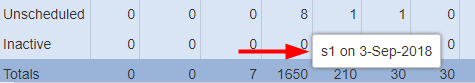
Displayed below the schedule name are several columns of information. The far left column, titled 'Provider name', alphabetically lists the names. Immediately below the active provider names is the entry 'Unscheduled', used to summarize any shifts that were left unscheduled in any of the schedules in the 'cumulative summary' range. If any of the providers scheduled for shifts in the schedules summarized are currently 'Inactive', their shifts are summarized in the line below the 'Unscheduled' entry; this additional line is labeled inactive. The bottom entry in the 'Provider name' column is the word 'Totals' . If percentages are being used in the display, an additional (Nominal%) line is added below the 'Totals' line.
To the right of the 'Provider name' column are up to sixty-two columns of cumulative summary information for your schedules. The actual number depends on the number of summary categories you have configured. The 'Standard' or 'Predefined' categories in each column display the title that you designated for each summary category. Below the title lines are displayed the scheduled values in that category for each provider.
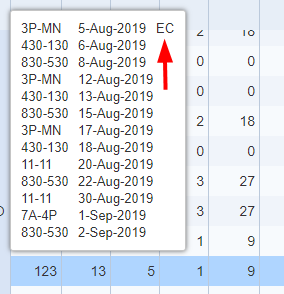
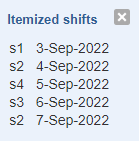
Values shown on the same line and to the right of each provider's name are the values pertinent to that provider
Any long term bias values (entered either in the 'Customize schedule' or in the 'Category Bias' screen are indicated by markers adjacent to the value to which the bias applies. A 'negative bias', a 'positive bias', and a 'prohibit bias'.
Values to the right of the unscheduled label indicate the calculated statistics for any unscheduled shifts.
Values to the right of the inactive label indicate the calculated statistics for providers scheduled for shifts in the schedules contained in the 'cumulative summary' but who are currently inactive.
Values on the bottom line to the right of the word 'Totals', are the total sums of all cumulative scheduled values for the range of schedules selected.
Sums & Targets: The requested target values for your 'Total Hours' summary category and for any request shift categories that you configured. Values for each provider are shown to the right of the cumulative summary values, separated by a slash mark (/). Note that ByteBloc detects the 'Total Hours' categories no matter what you may have named it. For example, an 'All Hours' or a 'Scheduled Hours' category would be recognized as the total hours 'cumulative summary category' if you have defined it to include all configured shifts.
If a provider has been scheduled for significantly more total hours or shifts than requested, the scheduled value is shaded in light red with a preceding plus sign (+). If a provider has been scheduled for significantly fewer hours or shifts than requested, the scheduled value is shaded in light green with a preceding minus sign (-). This color highlighting is done to bring to your attention the overscheduling (red with a plus sign) or underscheduling (green with a minus sign) of a provider. If the scheduled hours are still further off from target values, overscheduling is highlighted in dark red and underscheduling in dark green. The criteria for deciding the color highlighting that should be used varies depending on the priority for an exact match in the number of shifts, whether high, medium or low.
Note: If you requested that your cumulative summary starts or ends in the middle of a schedule, the 'Targets' display is not one of the summary options. ('Target values' do not apply to partial schedules and would be inaccurate.)
Sums & Percents: Display percentage values in addition to the hours and shift summary totals. You may initially find the displayed values somewhat confusing. Read through the following comments for an explanation.
Percentage values in all categories, except 'Off categories', indicate the percentage of shifts in the summary category that the provider was scheduled for as a portion of the total shifts for which he was scheduled. For example, a 10% value in a Night Shift category indicates that 10% of that provider's scheduled shifts are night shifts.
Off category percentages show the total percentage of shifts requested off in the category to which the 'Off category' is linked. For example, a 10% value in the Off Nights category indicates that the provider has requested off for 10% of the nights in the schedule.
Percentage values are truncated, not rounded (e.g., if the actual percentage is 65.8%, this is displayed as 65%, not 66%.)
When percentages are displayed, a (Nominal%) value is also shown on the bottom line of each 'summary category'. This represents the percentage that the shifts or hours in a summary category comprise out of all the shifts or hours in the cumulative summary. It is therefore the percentage of shifts providers would be scheduled in a category if shifts were equitably distributed.
Show Percents: Shows 'percentages only', with no other summary data. See the section immediately above for an explanation of percentage information.
Category Bias: Entries made from a 'cumulative summary screen' create 'short term bias values' which instruct ByteBloc to increase or decrease scheduling for an individual provider in a summary category during any future schedule creation and revision. This allows automatic adjustments in the long term balance of provider scheduling so that 'cumulative summaries' of shifts worked equalize over periods as long as several years.
Holidays: Available only if there are holidays contained within the summary date range of the currently displayed 'cumulative summary'. Click this button to display the 'Cumulative holiday' screen which displays a total of the 'holidays' within the 'cumulative summary' period.
Adjustments: Includes a listing of all adjustment entries made during the period covered by the 'cumulative summary'.
Settings: Access and modify settings for the current cumulative summary
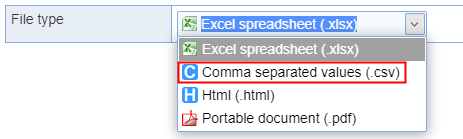
Export: Export your summary to various file formats
Count fractions of shifts: In statistical summaries, shift counts can be fractional to reflect 'As-scheduled' or 'As-worked' hours compared in relation to the shift duration. Display fractions of shifts for adjusted and split shifts.
Note: